Experience of integrating a power distribution management system (DMS) with a DIgSILENT PowerFactory network model.
Abstract
The power supply of the Yamal LNG plant is provided by an islanded on-site power station with an installed capacity of 376 MW, based on eight gas-turbine units. The distribution network spans four voltage levels — 110, 35, 10 and 0.4 kV — and comprises more than five hundred feeders. Islanded operation with its own generation places strict demands on calculations of static and dynamic stability, short-circuit currents and protection selectivity: keeping these calculations up with the pace of operation is practically impossible without an up-to-date digital model.
The power-system model in DIgSILENT PowerFactory has supported the plant for several years and has been repeatedly validated against real disturbances. This article describes a cycle that automatically updates the network model from DMS telemetry. The load-flow calculation runs as a single process, without opening the graphical shell — through PowerFactory's external-control (Engine) mode. The cycle starts automatically when a new telemetry export appears, and all control is concentrated in a Windows notification-area icon: launching the calculation, viewing results and case history, power-balance diagnostics, loading archived cases into the model. We cover the principles of mapping telemetry tags to model elements, the built-in monitoring of the active- and reactive-power balance across busbar sections, and automatic alerts on overloads and violations of the generation reserve.
Why an LNG plant needs a digital twin
LNG production is a continuous, high-responsibility process — an hour of unplanned shutdown of a production train is measured in millions of roubles of lost revenue. Islanded operation, with no connection to the Unified Energy System of Russia, further sharpens the criticality of every operating decision: a deficit or surplus of active power is immediately reflected in the network frequency, and a protection failure can escalate into a cascading disturbance. For this reason every connection of new loads, every change of protection settings and every change in the primary scheme goes through a preliminary calculation on the digital model.
The DIgSILENT PowerFactory model reproduces the full topology of the facility — synchronous machines with models of automatic voltage regulators and speed governors, power transformers, cable lines, switchgear cubicles, protection relays and emergency-control automation algorithms. The model's fidelity has been confirmed by repeated comparisons of computed transients against oscillograms recorded by protection relays during real disturbances; discrepancies in short-circuit current and frequency deviation in transient regimes do not exceed a few percent. The high accuracy in reproducing fault regimes stems from a comprehensive approach to gathering the source data. Static parameters of network elements were entered from as-built design documentation and manufacturers' equipment datasheets. To model the dynamic elements — excitation systems and turbine speed governors — standard IEEE mathematical models were taken as the basis; their parameters were initially tuned from the GTU manufacturers' technical datasheets and later refined based on the analysis of dynamic tests and disturbance events.
Model accuracy
| Event | Error |
|---|---|
| Short circuits in the 35 and 10 kV networks | < 1 % on short-circuit current |
| GTU trips, dynamic stability | < 0.05 % on frequency deviation |
Events of various classes have been successfully reproduced: double earth faults and three-phase short circuits in the 35 and 10 kV networks, emergency generator trips with operation of automatic underfrequency load shedding (UFLS) and the Load Shedding System (LSS), and inrush currents on energising power transformers.
What the model covers today
The digital twin of the power system regularly solves the main classes of operational tasks: analysis of disturbances with reconstruction of transients from protection-relay oscillograms; short-circuit calculations; calculations of normal, maintenance and post-fault steady-state regimes; transient calculations — starting currents of high-voltage induction motors, inrush currents of power transformers, static and dynamic stability of synchronous machines; review of design decisions at the detailed-documentation stage for new facilities.
All these tasks share one requirement — the correctness of the initial steady-state regime. For a network of more than five hundred feeders, manually gathering and verifying telemetry before every calculation took several working days, and a steady-state regime that was current at the start of the day no longer matched the actual equipment loading by its end. To make sure every calculation rests on the actual loading, model updating and the regime calculation have been combined into an automatic updating cycle that requires no input from a calculation engineer.
Automatic analysis of DMS data
The goal — every new telemetry export turns into an up-to-date calculation regime with no manual operations. The calculation runs in PowerFactory's external-control (Engine) mode: the controlling program connects to the calculation core, activates the project and the study case, applies the telemetry data to the model, performs the load-flow calculation and exports the results — all in a single process, without opening the graphical shell and without any manual operations in it.
Telemetry arrives from two independent DMS systems by different vendors: each covers its own segment of the plant's equipment and exports active (P) and reactive (Q) power values for each feeder. The input file format is recognised automatically by its signature, so both sources are accepted without switching modes. Start-up is automatic: a separate program continuously watches the export folder and launches the calculation as soon as a fresh export appears there.
The calculation pipeline
The calculation consists of four sequential stages combined into a single controlling process. Files of a strictly defined format are passed between the stages — this makes it possible to refine or replace any stage independently of the others.
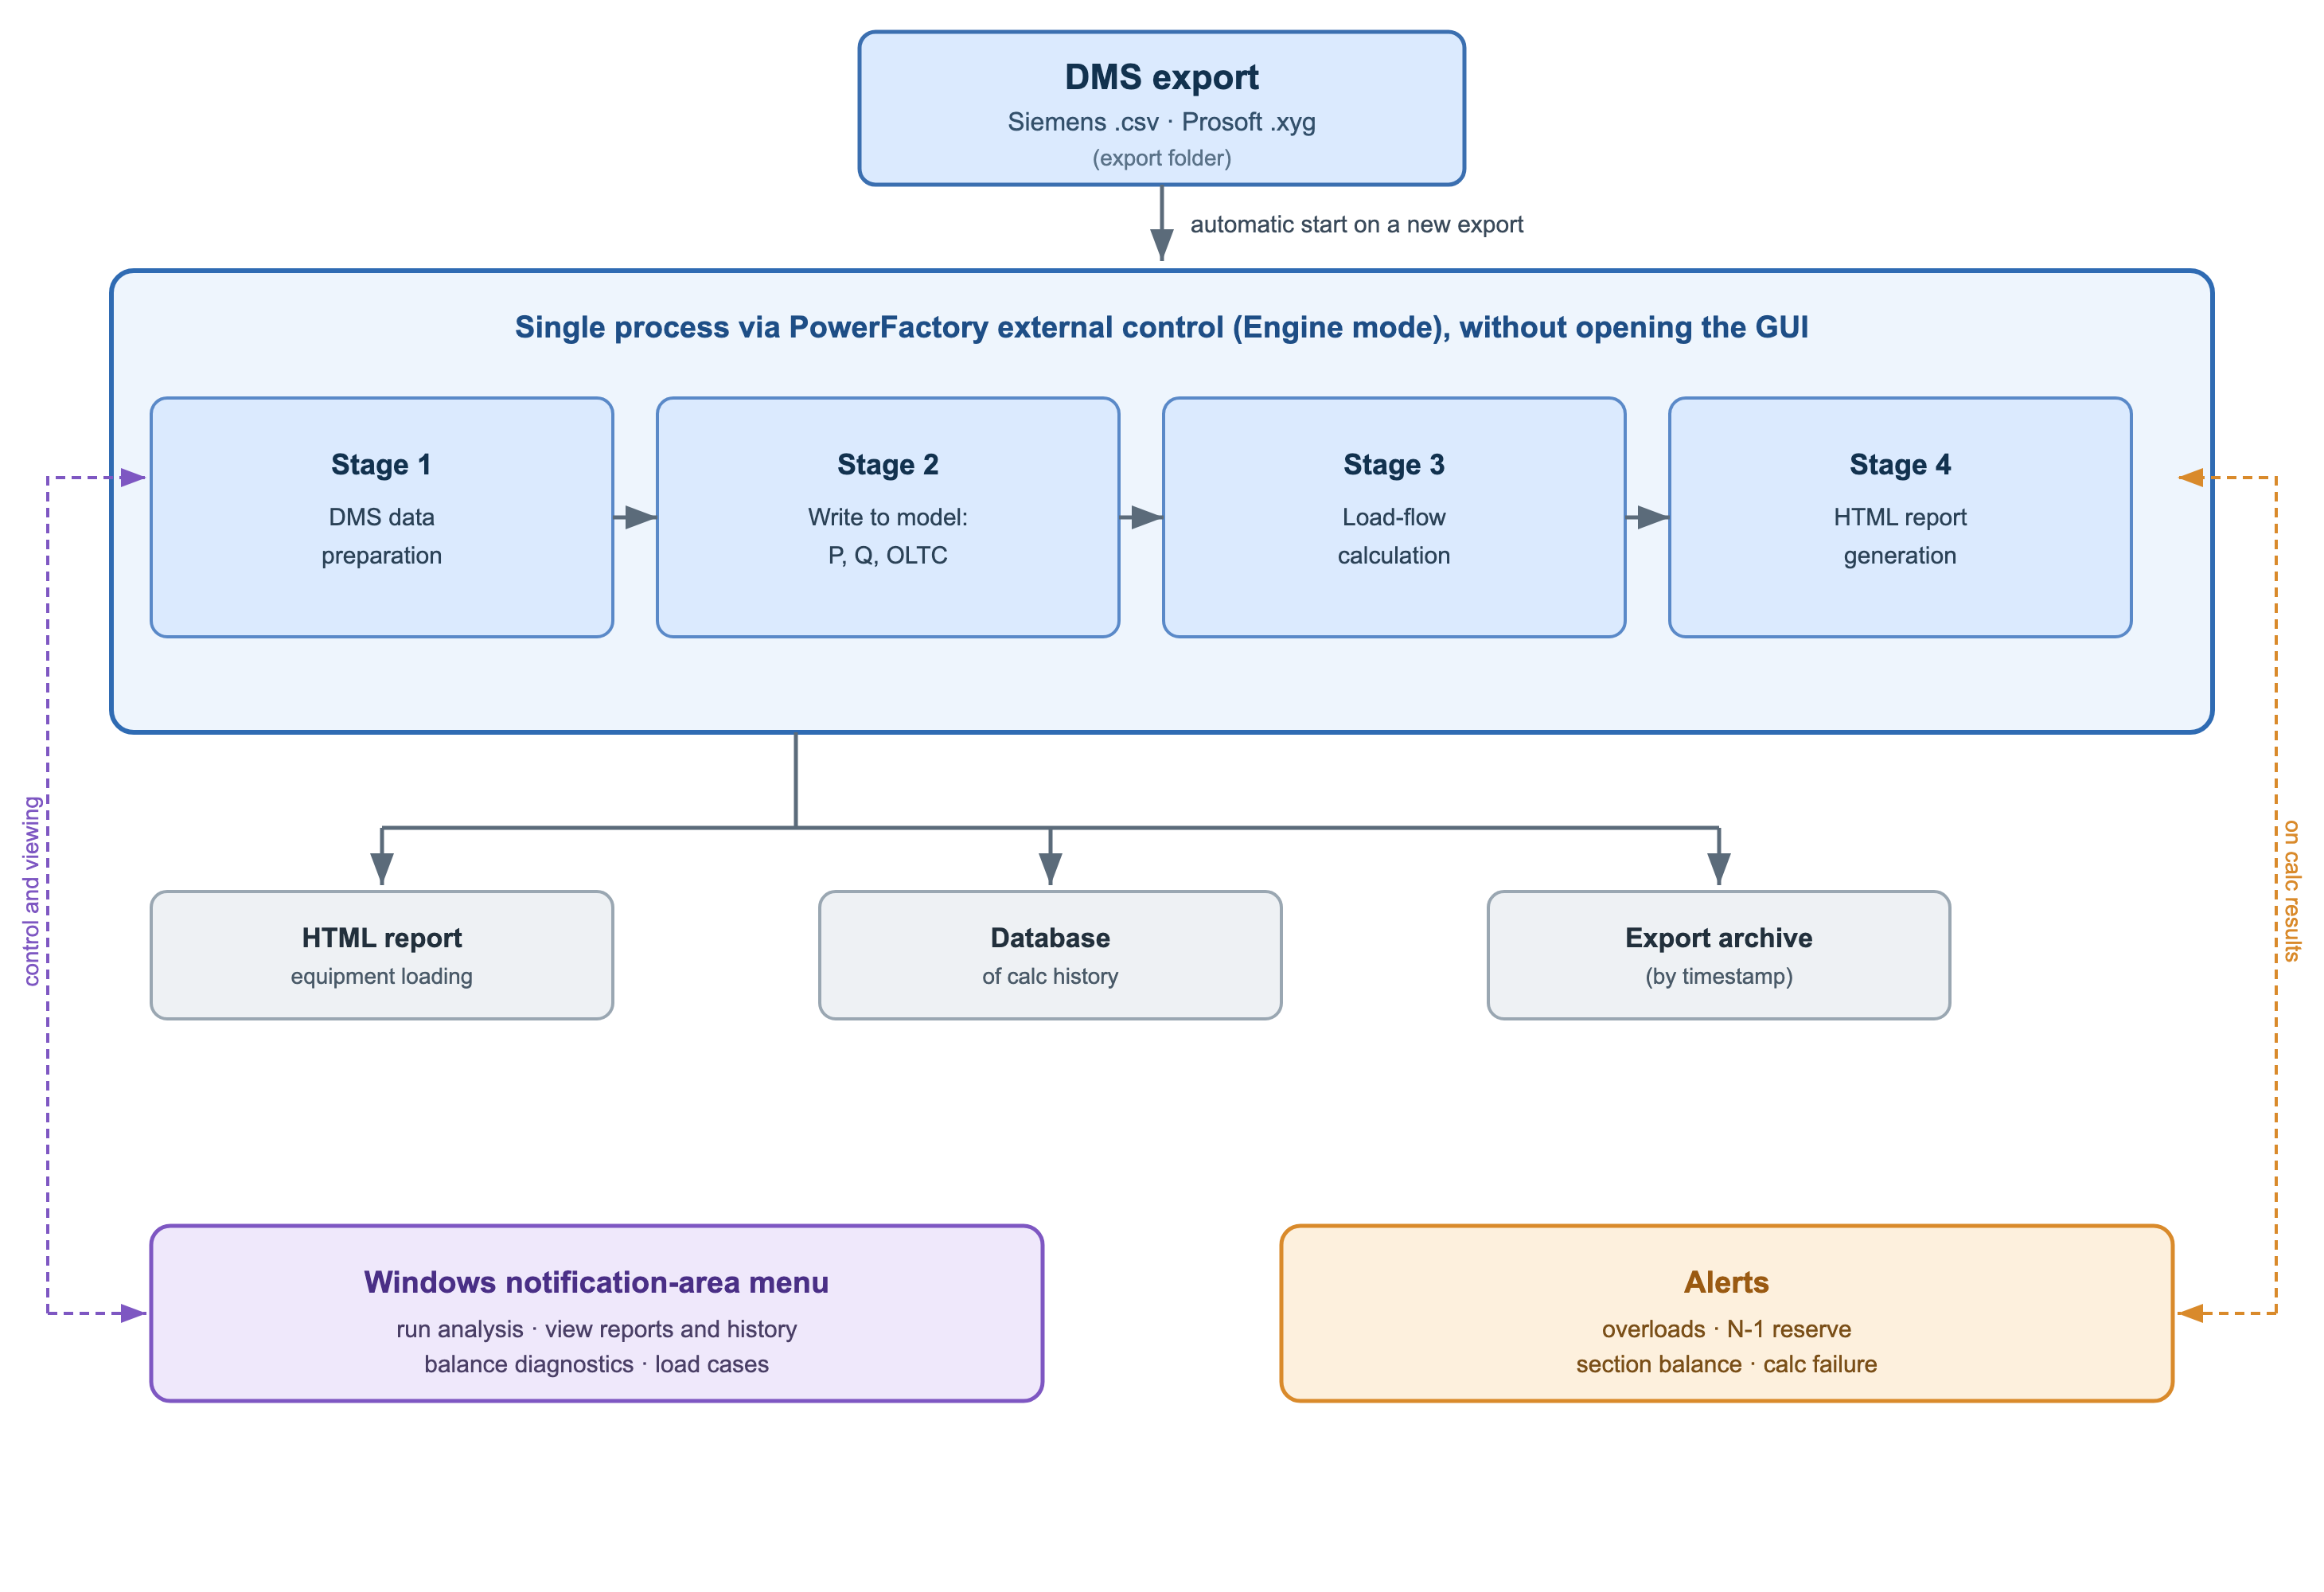
Stage 1 — data preparation. The controlling program reads the export files of both DMS systems, uses a mapping table to link each telemetry tag with a specific element of the model, and produces an intermediate file of a unified format. At the same time, active and reactive power are brought to unified units (kW and kvar) regardless of how they were stored in the source exports.
Stage 2 — writing data into the model. Through PowerFactory's external-control mode, the corresponding operations are applied to the model objects: writing the active and reactive power of loads, writing the active power of induction motors, writing the voltage setpoint in the station-wide voltage regulator, and also writing the actual voltage of busbar sections maintained by the on-load tap changers (OLTC) of the power transformers (the node target voltage from the corresponding telemetry channel).
Stage 3 — the load-flow calculation. The built-in load-flow module is run, and the results are saved in two formats: a one-off snapshot for the current task and a record in the calculation-history database. The database grows with every calculation, forming an archive of the actual loading of the primary equipment. At this same stage the generation reserve is computed by the N-1 criterion: the total rating of the running GTUs minus the current generation is compared with the capacity of the largest running GTU — this assesses the islanded system's ability to withstand the loss of one generator.
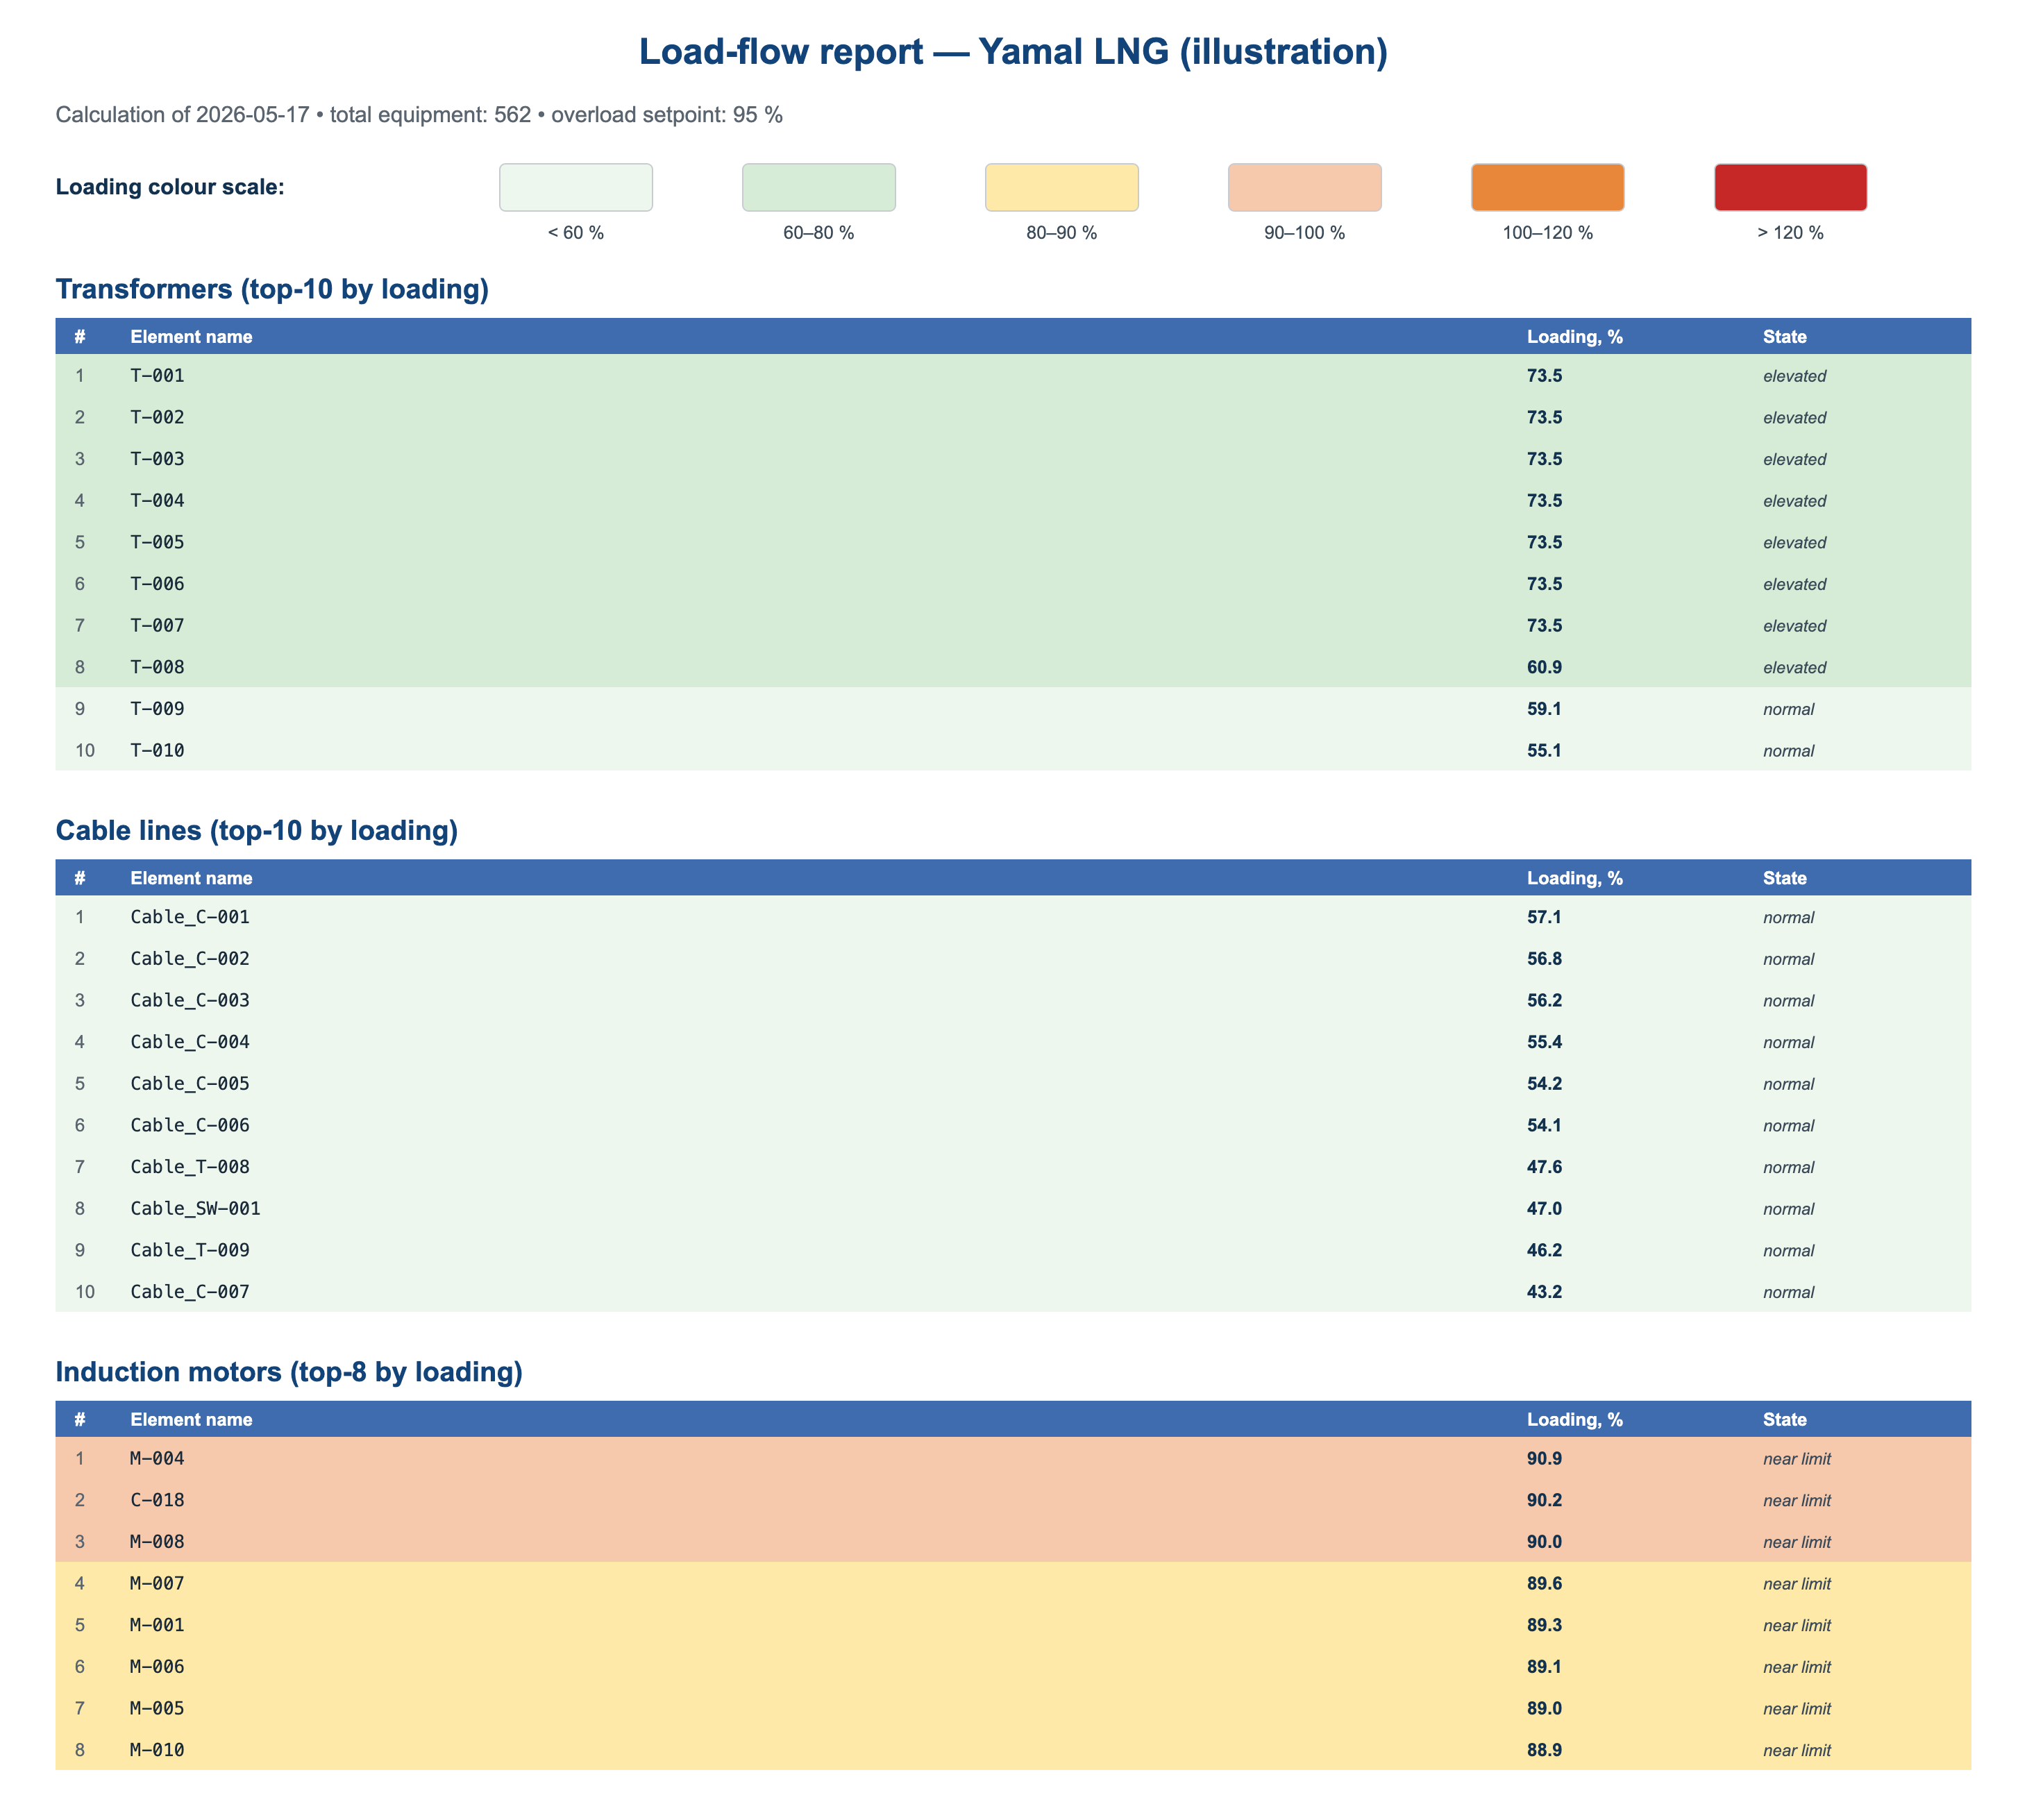
Stage 4 — report generation. Based on the steady-state snapshot, a single-page HTML report is produced with a colour scale of equipment loading (thresholds 60 / 80 / 100 / 120 % of the permissible value) and automatic highlighting of overloaded elements in a summary block.
After a successful calculation, the input exports are automatically moved to an archive and renamed by the regime's timestamp (the moment to which the telemetry refers). If an error occurs at any stage, the files stay in place for a repeat calculation session.
Control from the Windows notification area
All day-to-day control is concentrated in an icon in the Windows notification area (by the system clock). The icon colour reflects the current state: waiting for a new export, calculation running, paused, previous session error, PowerFactory GUI open. A click opens a menu grouped by function.
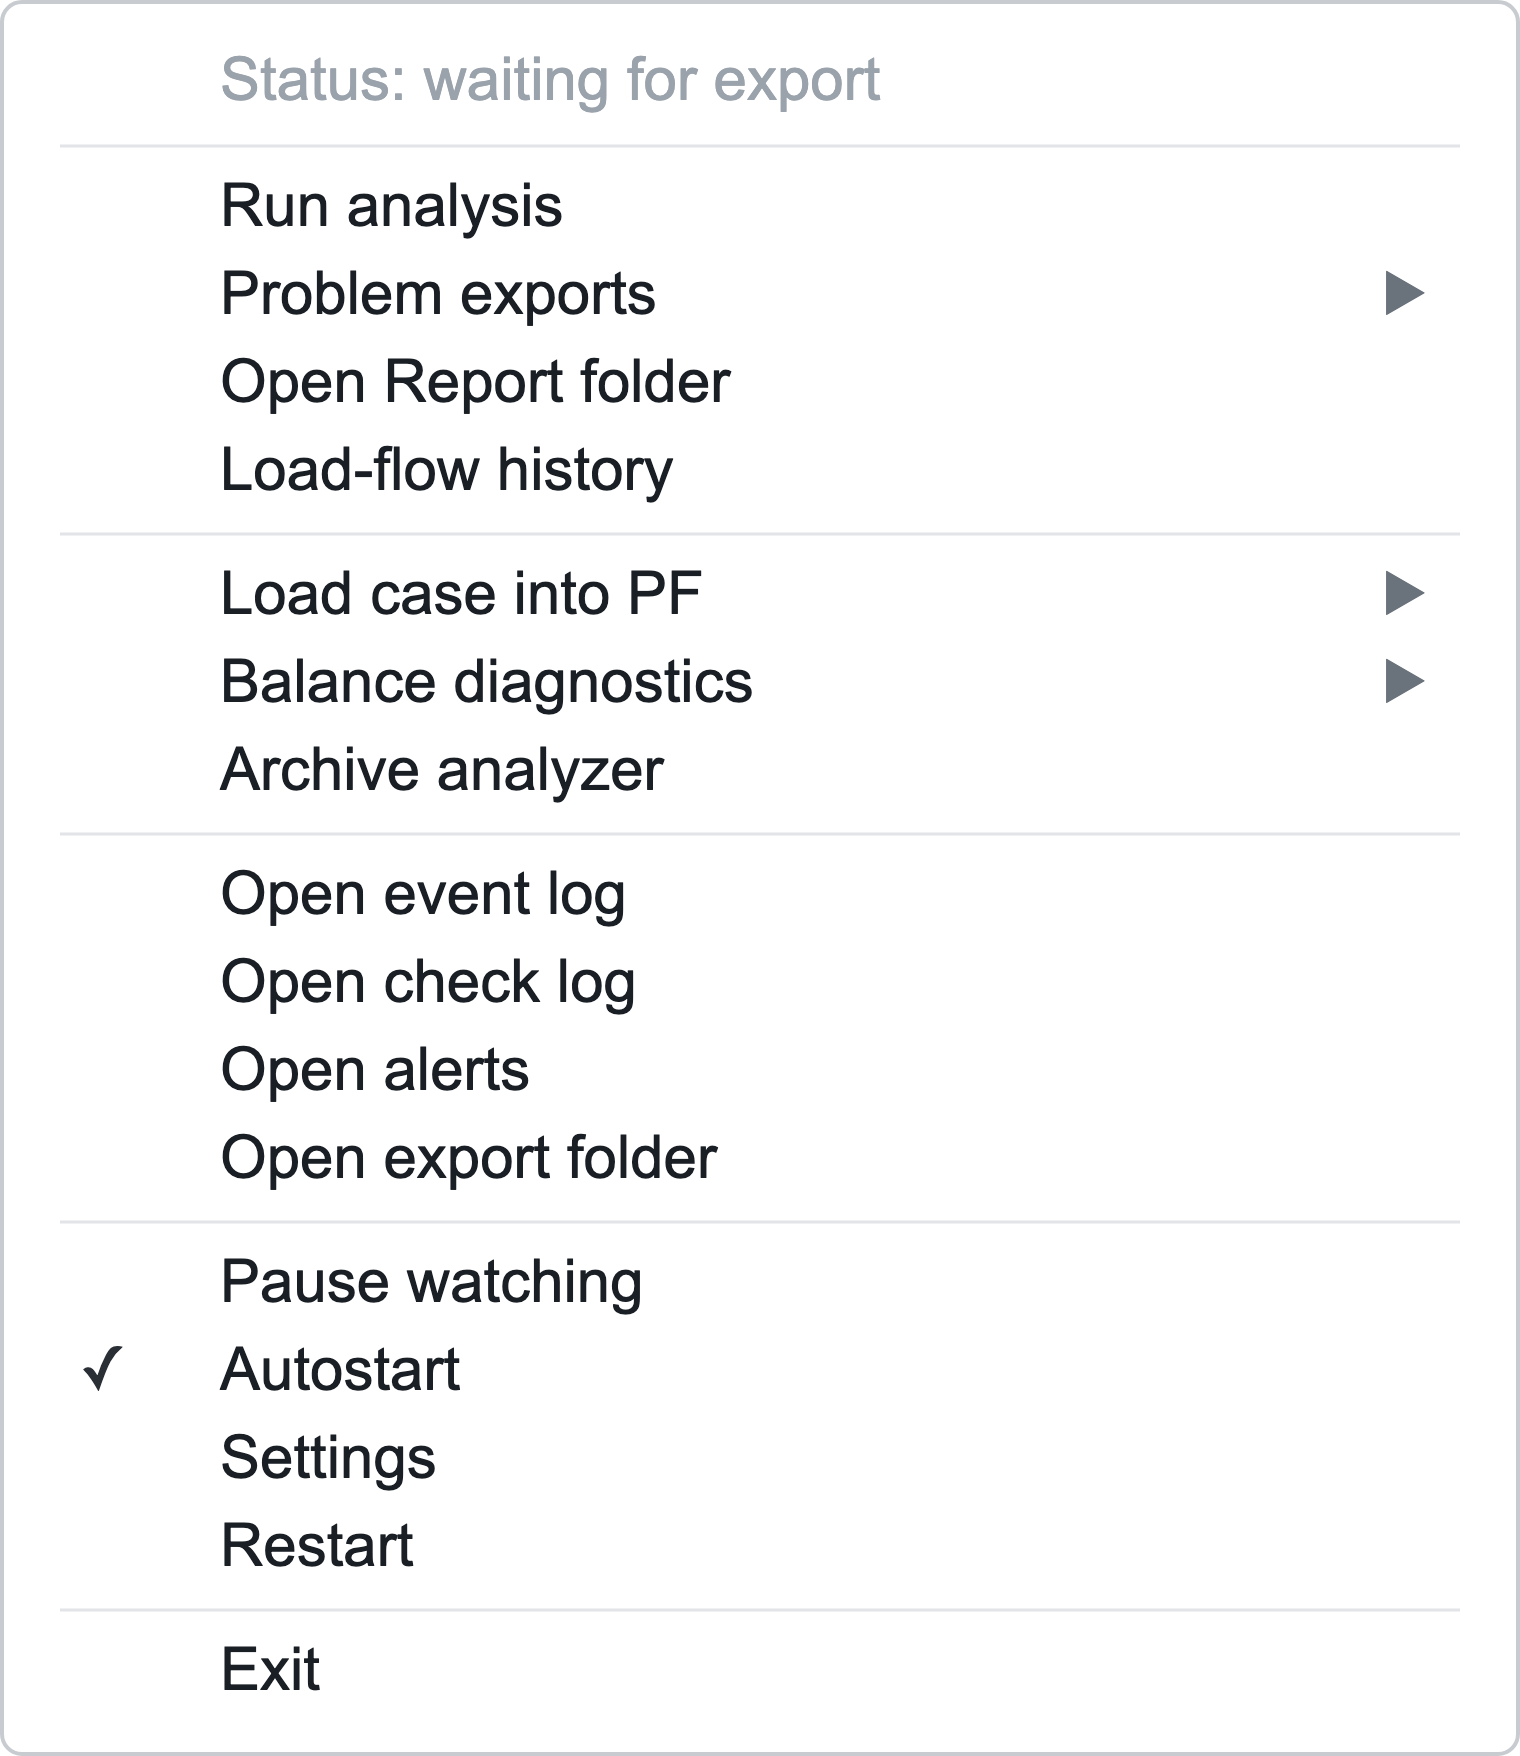
Launch and results. «Run analysis» — an immediate calculation on the current export, without waiting for the automatic start. «Open Report folder» opens the directory of ready HTML reports. «Load-flow history» rebuilds and opens the interactive viewer of regime history from the cumulative database.
Quality control. «Problem exports» — the list of regimes from the latest session for which the power balance did not converge or data-reading errors occurred; selecting an item opens the breakdown. «Balance diagnostics» — selecting a regime from the archive and building a detailed report on the power balance of the bus half-sections with the problematic ones highlighted.
Analysis of accumulated regimes. «Archive analyzer» — an application with a table of all accumulated regimes and metrics: maximum loading of transformers, cable lines and motors, overloads, generation reserve by N-1; the regimes can be ranked by a chosen element and filtered by date, overload and reserve. «Load case into PF» — loading a selected archived regime into a separate study case for subsequent manual analysis in the graphical shell, without affecting the operational regime.
Logs and service functions. Opening the logs of events, input-data checks and alerts, and opening the export folder. «Pause watching» temporarily suspends the automatic start; «Autostart» enables the application to start automatically at Windows login. While the PowerFactory GUI is open, watching is suspended automatically and resumes after it is closed.
Alerts. After every calculation the defined conditions are checked, and when one is triggered a pop-up notification is shown with a log entry: calculation failure, presence of overloaded elements, data read/write errors, violation of the N-1 generation reserve, non-convergence of the balance across busbar sections. This shifts the ongoing monitoring from the calculation engineer to the duty personnel — intervention is required only when an alert fires.
Analysis of the accumulated history of calculation regimes
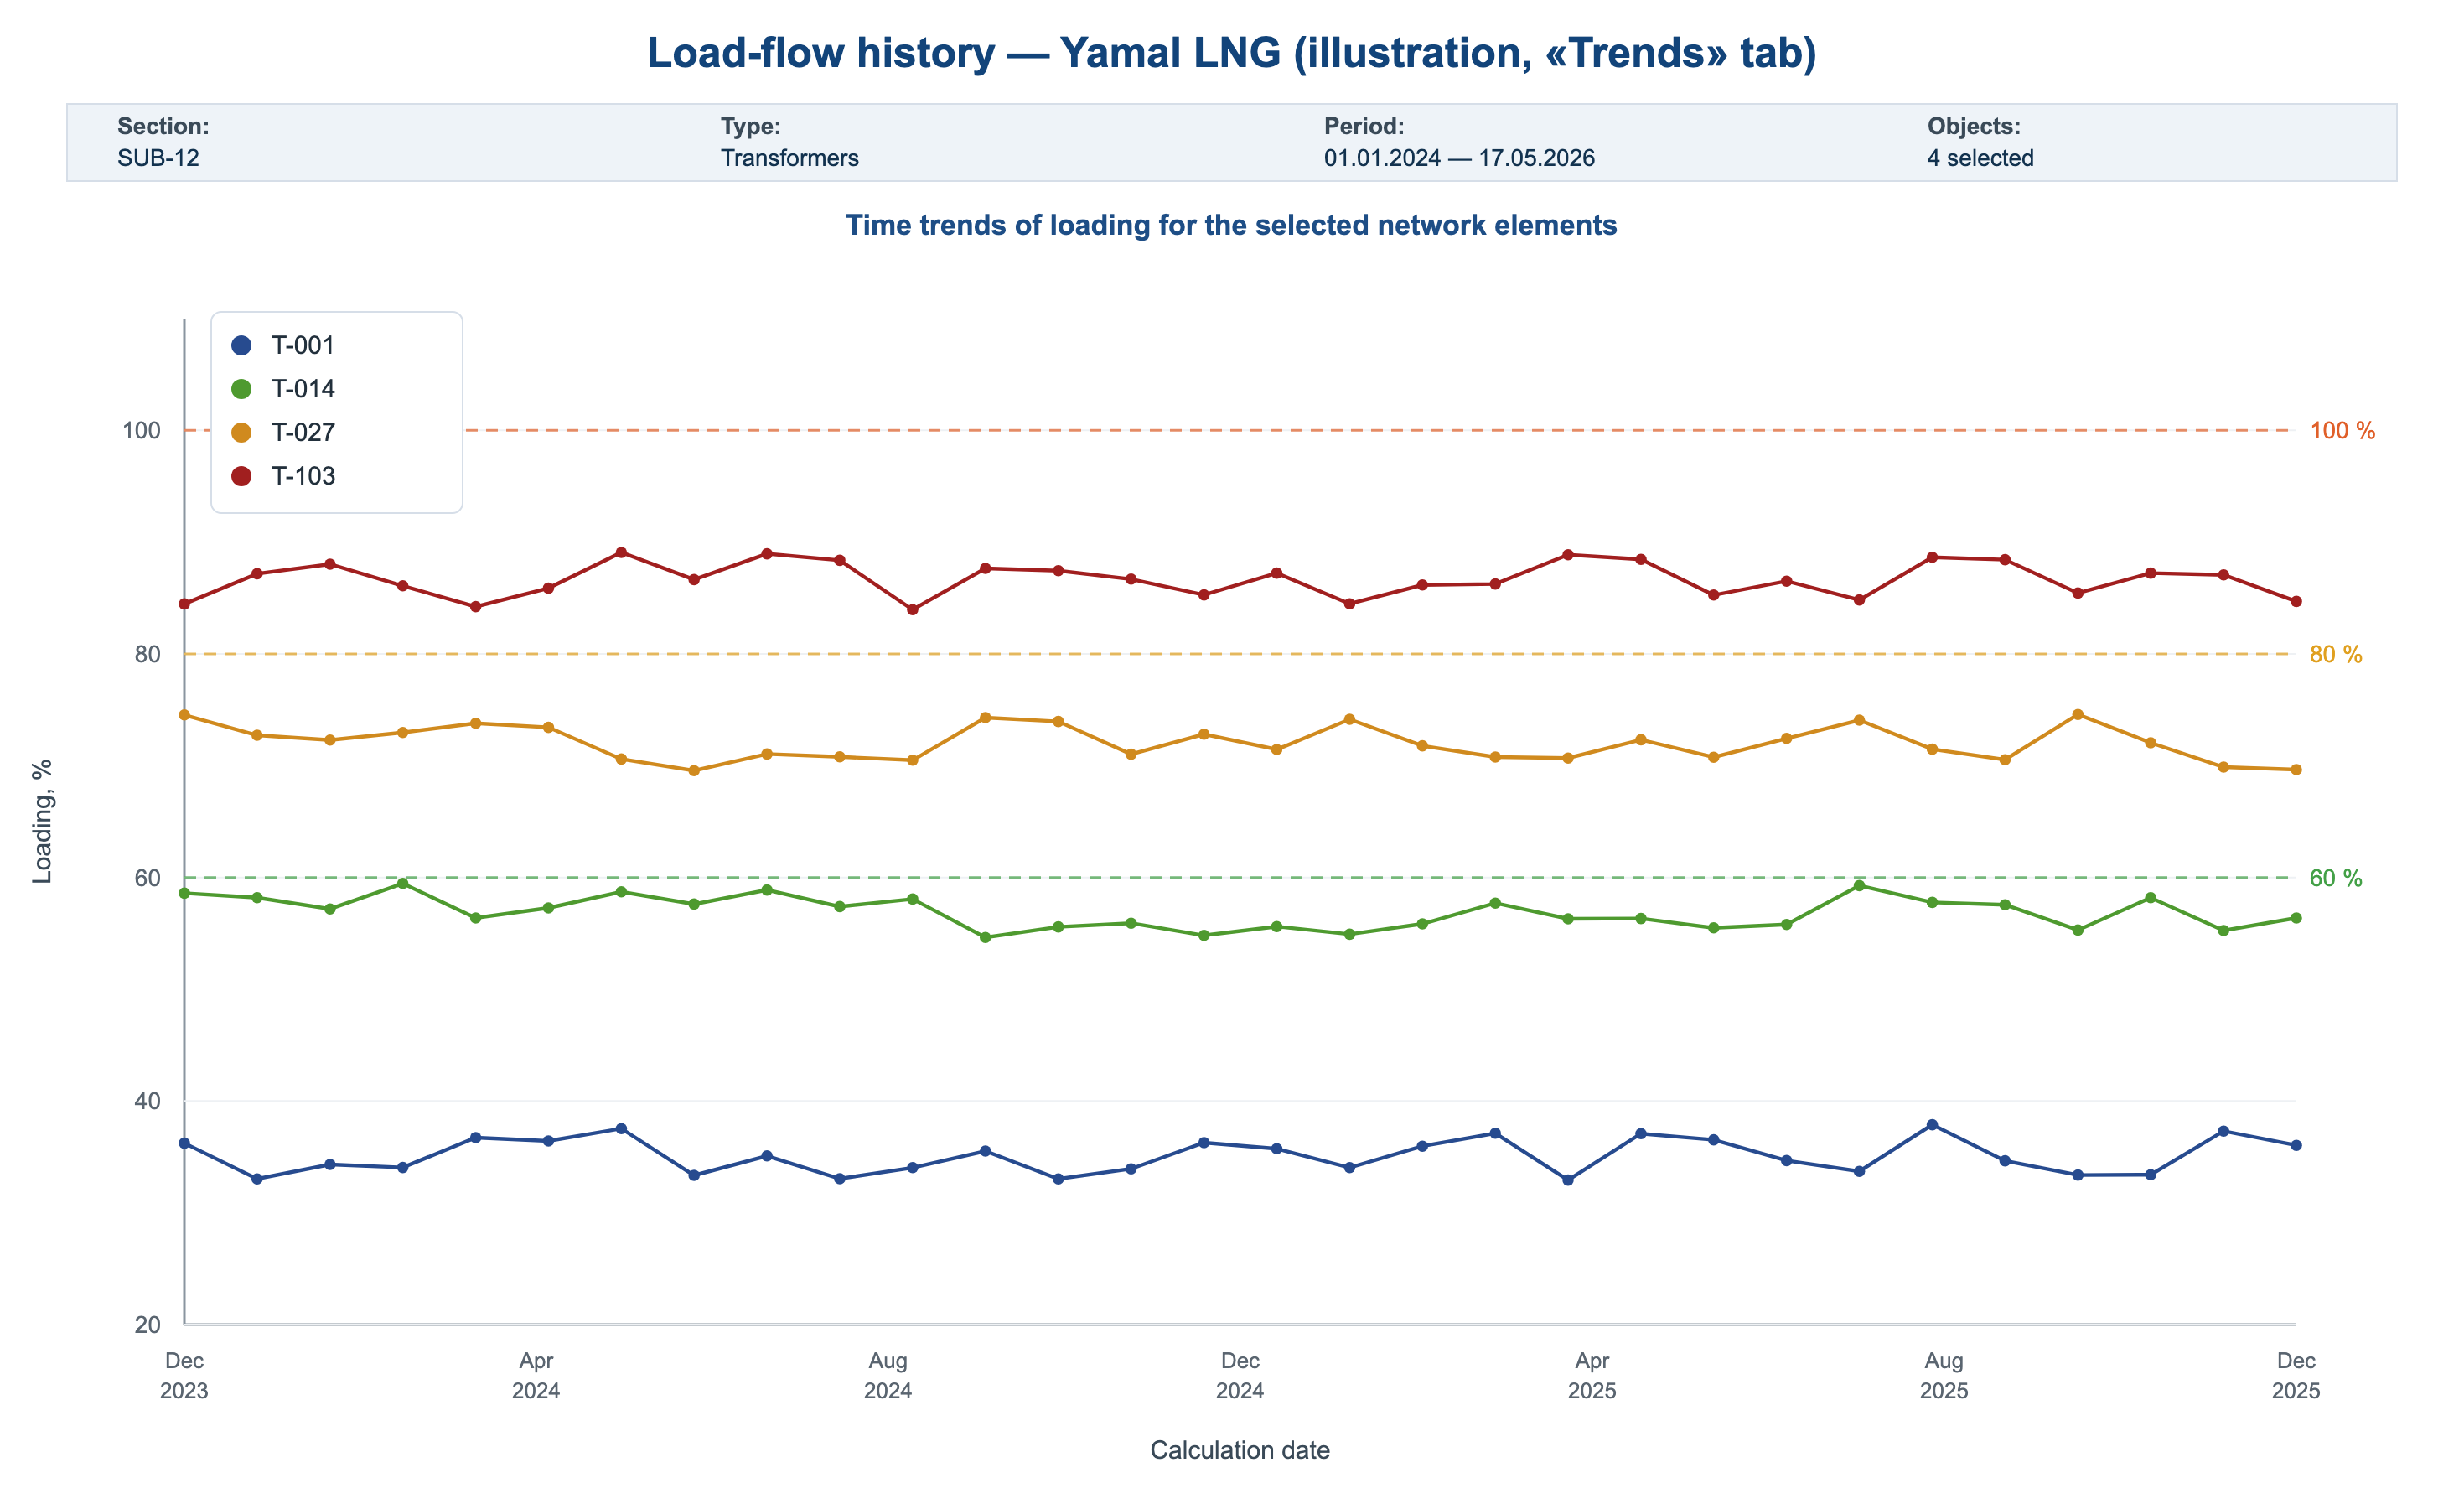
The history database mentioned in Stage 3 accumulates the results of all steady-state calculations and, over time, turns into an archive of the actual loading of the primary equipment. To work with this archive, an interactive tool was developed as an HTML page that opens in any browser without installing additional software (the «Load-flow history» menu item). The tool offers three data-visualisation modes:
- time trends of the loading of selected network elements, with the option to overlay horizontal threshold lines at 60 / 80 / 100 % for a visual assessment of the loading margin;
- comparison of two calculation regimes with a display of the loading change of each network element — for analysing the consequences of switching operations, scheme changes, or comparing characteristic operating regimes (winter maximum, summer minimum, etc.);
- an «network element × calculation» heat map for assessing the distribution of loading across the whole equipment list over a chosen period.
In addition, the «Archive analyzer» menu item gives a summary table of regimes with integral metrics (maximum loading by equipment class, overloads, N-1 reserve) and a ranking capability, while «Load case into PF» makes it possible to bring up any archived regime in the model for in-depth manual analysis.
Conclusion
Moving model updating into an automatic mode has changed the approach to preparing source data for calculations on the plant's power-system digital twin. Steady-state regimes, short-circuit and stability calculations are now performed on an up-to-date initial regime that reflects the actual equipment loading at the moment the telemetry was exported from the DMS. The spare capacity of power transformers and cable lines is determined from the results of real measurements accumulated in the calculation-history database, rather than from design estimates. The load-flow calculation runs without opening the graphical shell and without manual operations, starts automatically on a new export, and the ongoing monitoring and analysis of accumulated regimes are available to duty personnel through the notification-area menu — without a calculation engineer.
The solution described is applicable to other industrial facilities that have their own power station, a power-system model and a distribution management system. Adaptation comes down to configuring the table that maps DMS tags to model elements and accounting for the specifics of the enterprise's primary scheme.
The approach, implemented in-house, compares favourably in cost with the well-known commercial counterparts — the real-time modules within DIgSILENT PowerFactory and ETAP Real-Time, whose licence cost for a power system of this scale runs into tens of millions of roubles. At the same time the operational effect achieved — a calculation on up-to-date telemetry within minutes — is comparable.
At the current stage the only manual action that remains is producing the export in the DMS. The DMS implementation used at the site has no function for automatic periodic template-based exports, so this step is performed by an engineer manually. Analysing this limitation makes it possible to formulate the basic technical requirements for upper-level systems (DMS) for the maximum automation of their integration with calculation suites:
- Export automation: a scheduler for cyclic telemetry export at a configurable interval in automatic mode.
- Direct programmatic access: an open API or support for integration standards (OPC UA, direct SQL) for the calculation pipeline to extract data directly from the real-time database, bypassing intermediate files (CSV/TXT).
- Data standardisation: support for data exchange based on the CIM information model (IEC 61970/61968), which allows network elements to be mapped automatically without manual tag mapping.
Building these requirements into the DMS architecture would turn the calculation pipeline into a fully autonomous system.