One run of Tekvel Magic — and the device chosen from the SCL comes alive: an MMS server is started from its data model, and a control panel opens in the browser. You change signal values and quality — and the upper-level client receives real dchg/qchg reports, exactly as from a real IED. The module works without a single physical device on the bench: an SCL file is enough.
In the previous articles of the series we showed how Tekvel Magic reconciles the configuration from an SCD with the actual IED configuration, how it captures, in one click, the current state of the report control blocks over MMS and how it turns an SCL configuration into a readable telemetry transfer form. Today — the fourth case, which tackles the task from the other side of the table. Until now Magic worked with what already exists: files and live devices. Now it becomes the device itself — to test the one that receives those reports.
Why emulate a device at all
Telemetry transfer over IEC 61850 always has two sides: the server device (a protection IED, a bay controller, a measurement transducer) that generates the reports over MMS, and the upper-level client (a telecontrol server, SCADA) that subscribes to those reports and displays them to the operator. The first side is usually tested inside out on a project. But the receiving side — exactly how the upper level receives, parses and shows the reports — is far harder to test.
The reason is simple: to fairly test the client you need a working server that delivers the right data at the right moment. And that is where the difficulties begin:
- Some devices are not on site yet, or are not fully commissioned. Setting up and accepting the upper level often runs in parallel with configuring — or even delivering — some of the devices, and sometimes ahead of it. There is nothing to test the upper level against.
- The device is there, but you cannot get the required state out of it. How do you make a real terminal output
bad-statefor a switch position,questionablequality or atestflag — and in a controlled sequence at that? On a live device this is either impossible or unsafe (for example, because the facility's bays are already in operation). - You need to reproduce a rare scenario. Loss and recovery of validity, value substitution — such situations simply cannot be created on a real facility.
As a result, acceptance of the upper level often turns into watching whatever happened to arrive from the network, instead of purposeful testing. The Tekvel Magic module presented here closes that gap: it starts an MMS server straight from an SCL file and provides a convenient panel from which the engineer controls signal values and quality — and watches how the client reacts.
Place in the series of SCADA testing scenarios: read, show, document — and play the device
To avoid confusing closely related tasks, it helps to keep in mind the split across the whole series of SCADA-related testing scenarios:
- Case #1 — conformance: reconciles the design SCD with the actual device configuration over MMS and produces a deviation report.
- Case #2 — state: connects to the devices over MMS and shows how the reports work right now (RptEna, Owner, who is subscribed to what).
- Case #3 — documentation: takes the SCL configuration and turns it into a readable telemetry transfer form, offline.
- Case #4 — emulation (this one): takes the SCL configuration and becomes the device it describes, generating real reports to test the receiving side.
The key difference of the fourth case is that it is active. The first three work with what already exists: they read, compare, show, document. Here, for the first time, Magic does not watch the traffic but creates it — it acts as an IEC 61850 server and plays the role of a device that may not even be present on site yet, or may not be configured. This shifts the focus of testing from the device to the upper level: not «is the IED configured correctly», but «does the one above receive and display the data correctly».
How it works
The scenario is as short as it gets. You launch the module — and in the first dialog you select an SCL file: it can be a stand-alone CID/ICD with a single device or a substation SCD with several dozen IEDs. If there are several devices in the file, the module offers you to pick one — the one it will «play».
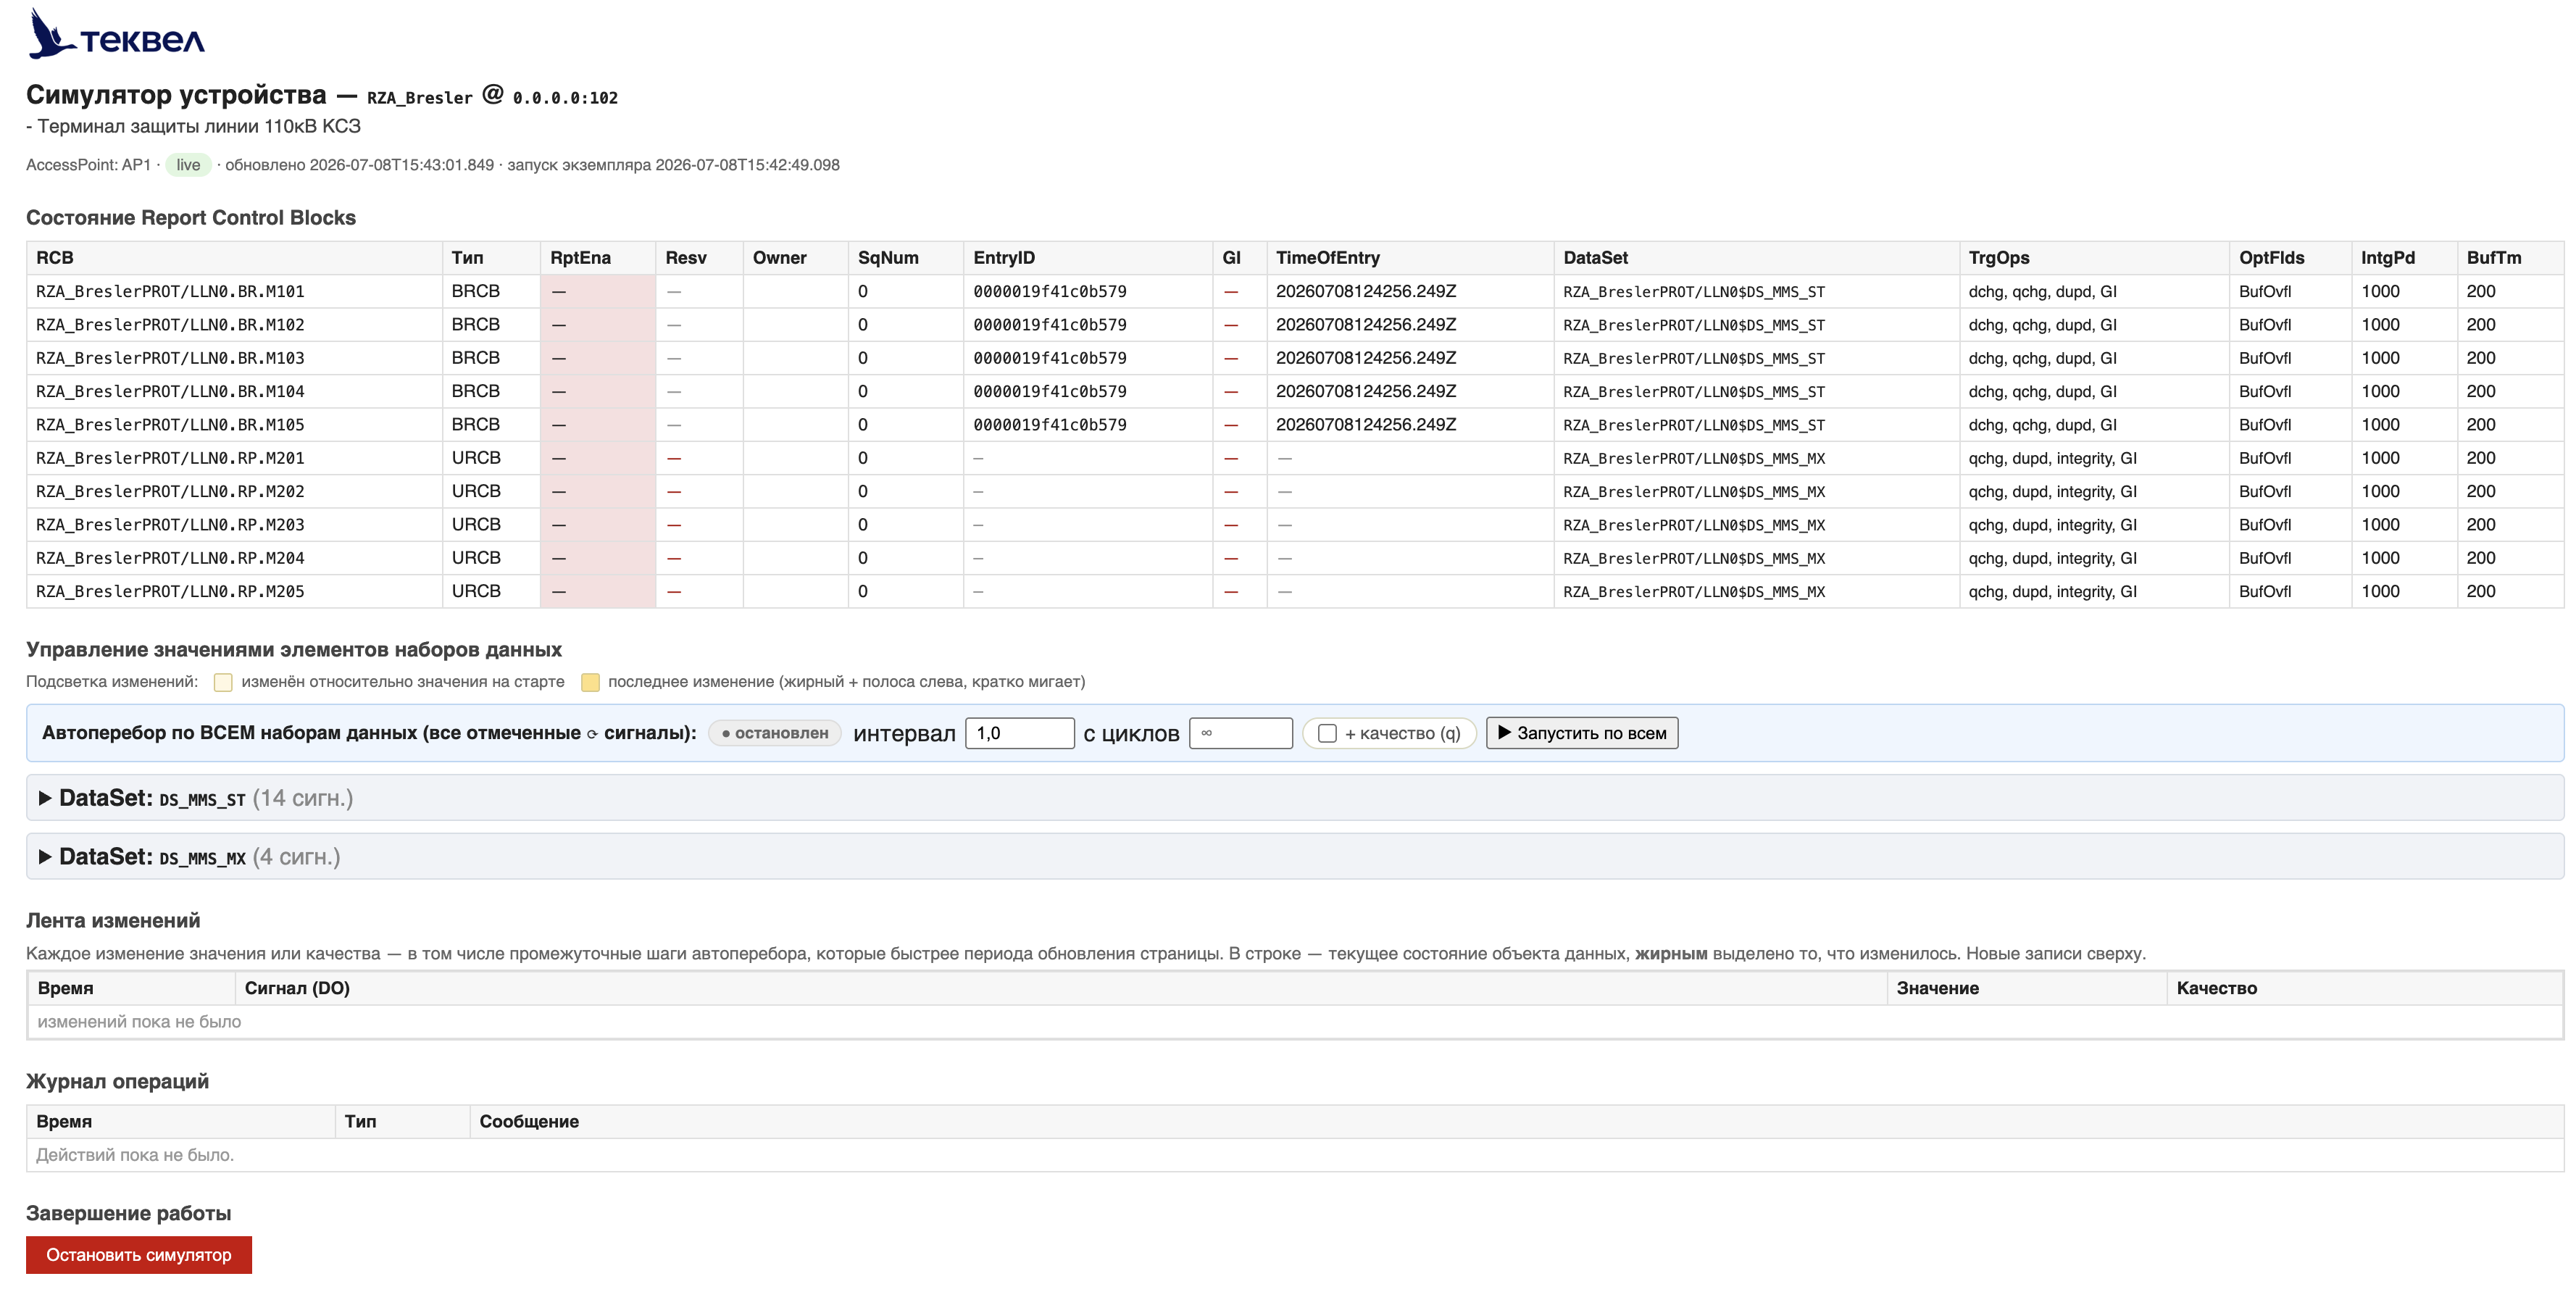
After that everything happens automatically: the module starts an MMS server from the data model of the selected device and opens a control panel in the browser. From this point on, to any upper-level client on the network the simulator is indistinguishable from a real IED: it has the same data model, the same report control blocks, the same data sets and the address from the SCL.
The whole path is easy to follow as a flow chart — from choosing the file to the flow of reports to the upper level:
flowchart TB
    A["Launch the module"]
    F["Select an SCL file<br/><i>CID / ICD / SCD</i>"]
    S["Select a device<br/><i>if the file has several IEDs</i>"]
    P["Check: are there RCBs<br/>with data sets?"]
    B["Start the MMS server<br/><i>model of the selected IED</i>"]
    C["Internal client<br/><i>readback + background polling</i>"]
    W["Web panel<br/><i>opens in the browser</i>"]

    A --> F --> S --> P --> B
    B --> C
    B --> W
    W ==> ACT

    subgraph ACT["Engineer’s actions in the panel"]
        direction TB
        V["Change signal values"]
        Q["Change quality (validity / test / source)"]
        AC["Auto-sweep of values and quality"]
        V --> RPT
        Q --> RPT
        AC --> RPT
        RPT["dchg / qchg reports over MMS"]
    end

    ACT ==> EXT["<b>UPPER-LEVEL CLIENT</b><br/>SCADA / gateway / dispatch —<br/>receives and displays reports"]

    style A fill:#F3F3F3,stroke:#888
    style F fill:#E0F2F1,stroke:#26A69A,color:#004D40
    style S fill:#EDE7F6,stroke:#7E57C2,color:#311B92
    style P fill:#EDE7F6,stroke:#7E57C2,color:#311B92
    style B fill:#E3F2FD,stroke:#42A5F5,color:#0D47A1
    style C fill:#E3F2FD,stroke:#42A5F5,color:#0D47A1
    style W fill:#E3F2FD,stroke:#42A5F5,color:#0D47A1
    style V fill:#FFF8E1,stroke:#F9A825,color:#E65100
    style Q fill:#FFF8E1,stroke:#F9A825,color:#E65100
    style AC fill:#FFF8E1,stroke:#F9A825,color:#E65100
    style RPT fill:#E8F5E9,stroke:#43A047,color:#1B5E20
    style EXT fill:#E8F5E9,stroke:#43A047,color:#1B5E20
It is worth noting separately the handling of a substation SCD. Under IEC 61850-6, such a file describes dozens of devices in a single model — and you cannot start a server for a single IED directly from it. The module solves this itself: it extracts the selected device into a temporary single-device file, carefully handling the access points (including the ServerAt construct, where one point references the server of another). The engineer does not need to think about this — it is enough to specify the device name.
One more point — Tekvel Magic can expose the simulated device at its IP address extracted from the SCL file. That matters too.
What the control panel can do
The panel opens in an ordinary browser and updates in real time. Inside — several coordinated blocks.
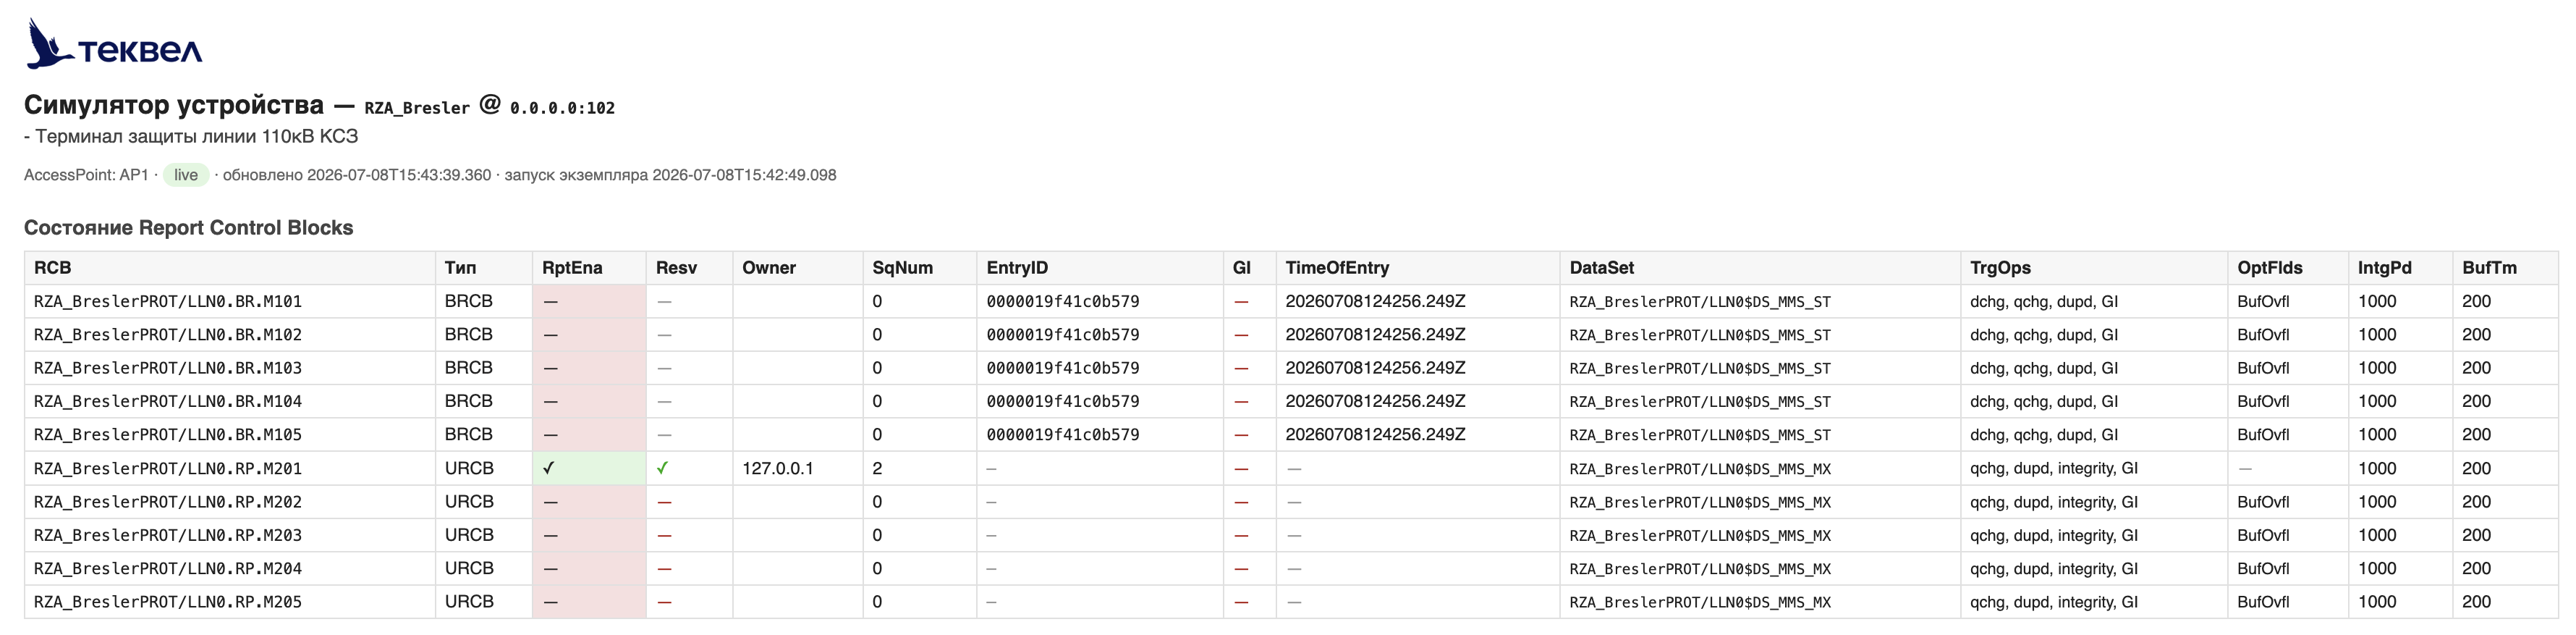
The state of the report control blocks exposed by the simulated device. A table of all blocks — buffered (BRCB) and unbuffered (URCB) — with their live state: RptEna, SqNum, EntryID, Owner, the general-interrogation flag (GI), the time of the last event, the data set, the active triggers (TrgOps) and the optional fields (OptFlds). You can see which client subscribed to which block and what is actually enabled.
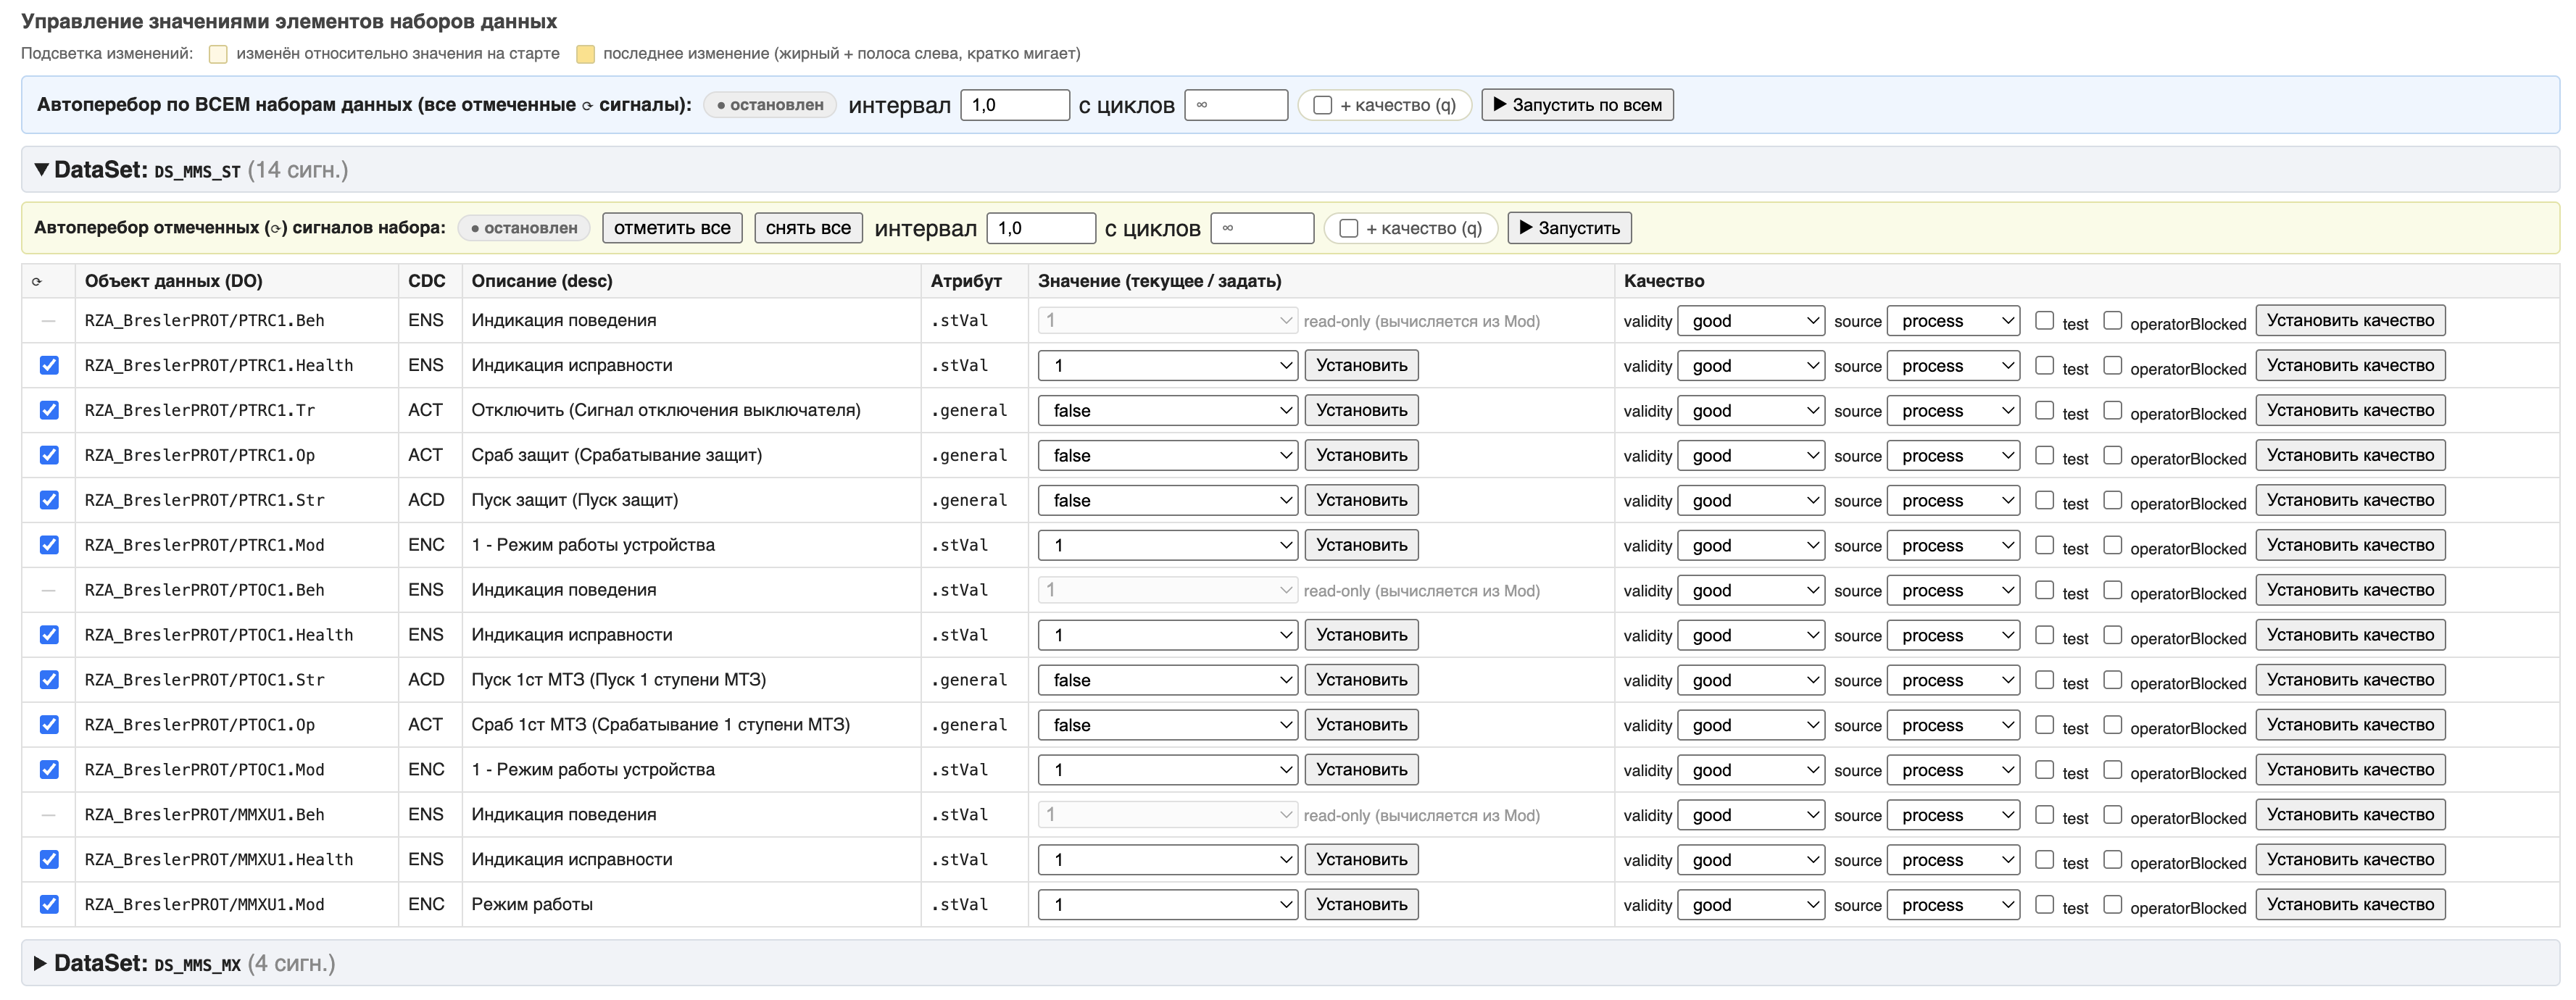
Value control. The signals are grouped by data set. For each data object the panel picks a convenient input by itself: a drop-down list for discrete signals (switch position — off/on/intermediate/bad-state), a numeric field for measurements. Multiphase quantities (WYE/DEL/SEQ) are written across all phases at once. Every write is verified by readback — what you see in the panel is guaranteed to have gone into the model and into the report.
Quality control. A separate form for each signal: validity (good / invalid / questionable), the test and operatorBlocked flags, the process/substituted source. Any change of quality generates a qchg report — exactly what you need to check how the upper level displays invalidity and test data.
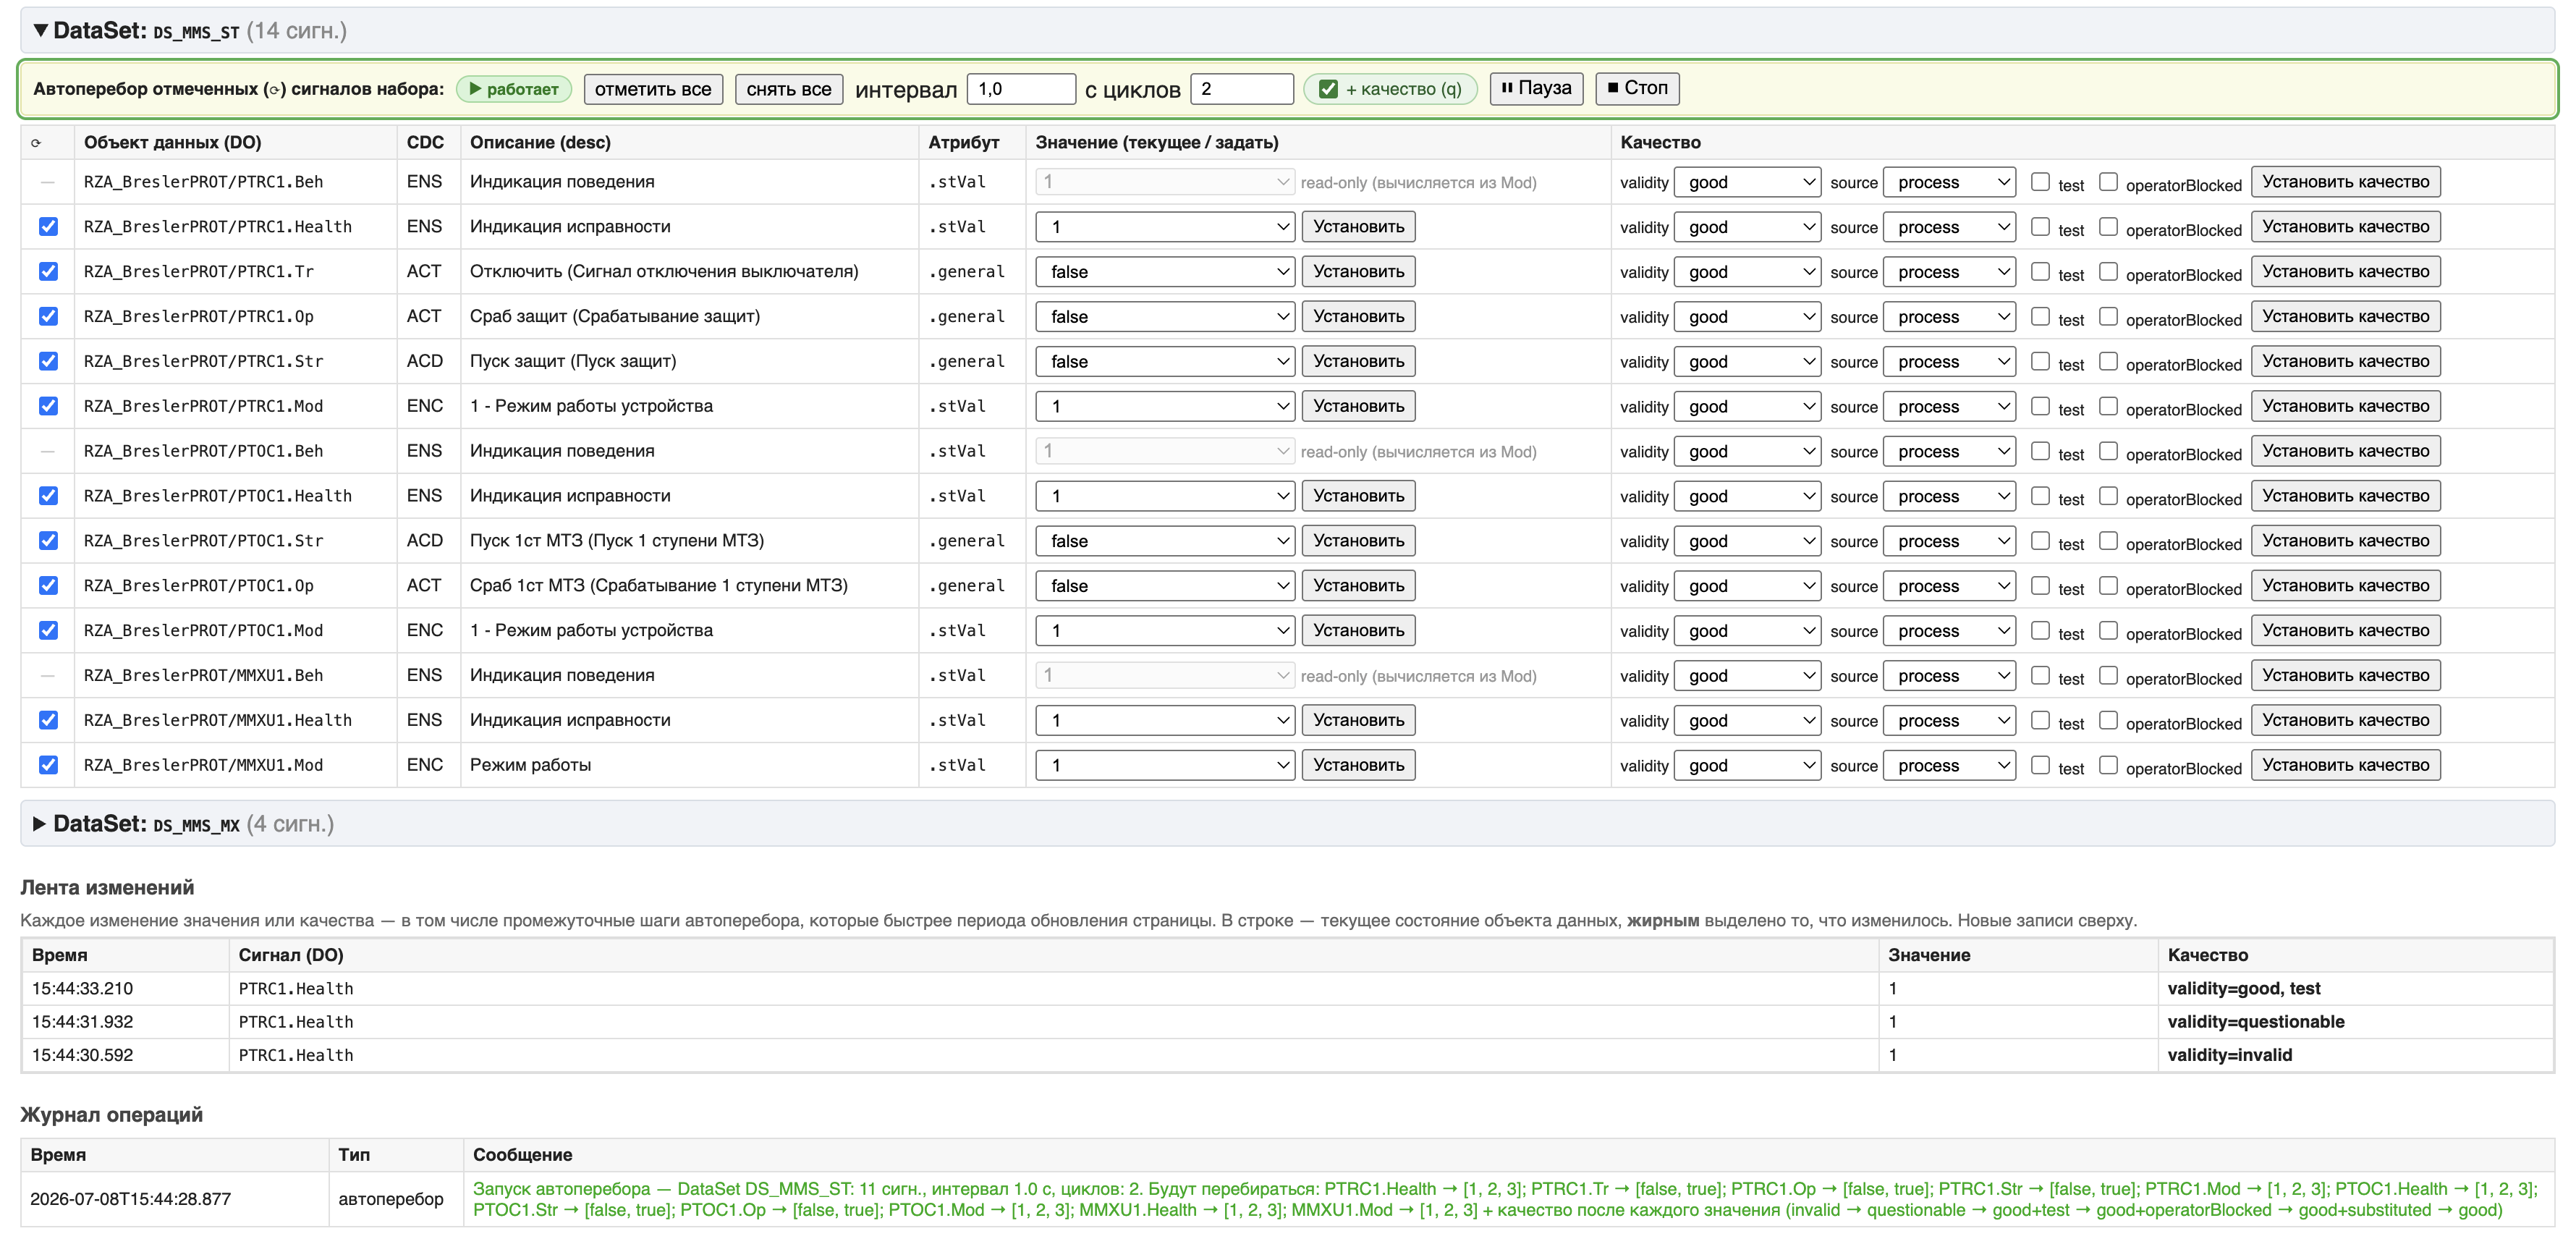
The change feed and the operations log. Every change of value or quality is recorded in a chronological feed — with the current value, the current quality and a timestamp. A separate log of operator actions is kept. Nothing is lost, even if the changes come faster than the page refreshes.
Auto-sweep — bulk scenario testing in one click
Manual switching is good for spot checks, but when you need to run a signal through all its states — or test a whole data set at once — the auto-sweep comes to the rescue. You tick the signals, set the interval and the number of cycles — and the module cyclically walks through all the meaningful values of each signal depending on its type (CDC):
- discrete (DPC/DPS): off → on → intermediate → bad-state;
- single (SPC/SPS/ACT): false → true;
- enumerated and integer (INS/ENS): over a series of values;
- measurements (MV/CMV/WYE/DEL/SEQ): over a series of values.
With the «+ quality» option enabled, after each value it can additionally run through a sequence of validity states: invalid → questionable → good+test → good+operatorBlocked → good+substituted → and back to good. So in a single run the upper level receives the full spectrum of «value × quality» combinations — ideal for checking the display of all states at once. The sweep can be paused or stopped; on stop, the quality of all signals is neatly returned to good so the model is not left in a «corrupted» state.
What it is good for in practice
The main value is the ability to test the upper level when it is convenient, rather than when you «get lucky» with traffic from real devices.
Commissioning the upper level ahead of time. The devices are still in transit, but the telecontrol server or the SCADA server already needs to be set up and tested. The simulator, built from the design SCD, plays the future device — signal mapping, report subscriptions and display can be debugged in advance.
The upper level is deployed when the cabinets are already in operation. A common situation: the protection and SCADA cabinets of a bay have long been in service, while an extension or upgrade of the upper level (a new SCADA server, a gateway, a control centre) is done later. You can no longer initiate signal changes from the live devices to test reception at the upper level — the equipment is under load, and interfering with its operation is not allowed. The simulator removes this constraint: it acts as a «stand-in» for the working device using that device's own SCL configuration, and all the required changes — positions, measurements, quality — are initiated from it, without touching the real cabinets in operation.
Testing the display of quality and test data. How will the operator see a signal with invalid quality? Will the upper level filter out data with the test flag? The simulator lets you set any combination of quality bits and watch the reaction — something that is practically impossible to reproduce on a live device.
Reproducing rare and «awkward» scenarios. An intermediate switch position, loss of validity and its clearing, a burst of fast changes — all of this is set from the panel or run by the auto-sweep in a controlled sequence.
Training and demonstration. The simulator is a visual bench for training staff to work with IEC 61850 reports and for demonstrating how telemetry transfer looks «in motion».
Together with the previous cases, this makes a good set of test scenarios for a modern SCADA engineer. Case #1 checks that the device is configured to the design; case #2 shows how the reports work now; case #3 produces readable documentation; and case #4 lets you play the device and make sure the upper level receives and displays everything correctly. «How it is configured», «how it works right now», «how to explain it to others» — and, finally, «how it will be received at the other end».
Enjoy using it! And remember, IEC 61850 engineering sometimes calls for a little Magic :)